Pharmaceutical company improves OEE by 10% in 6 months by achieving maintenance excellence
Read the story

Save Energy, Buy Time
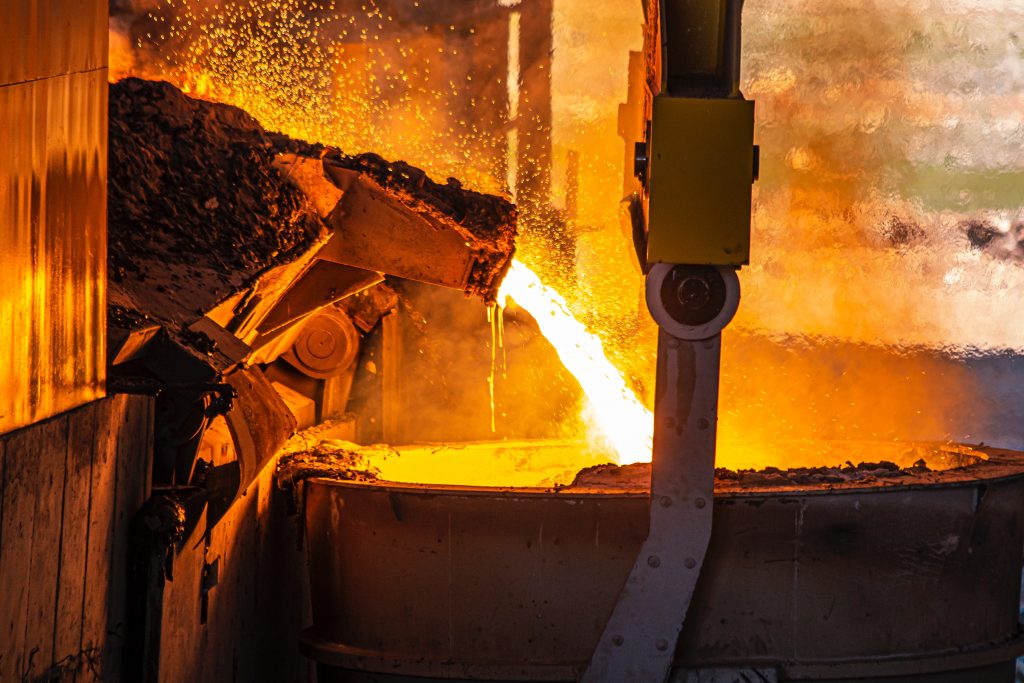
To roll a steel block into a strip, lots of precisely aligned work steps are required.
These work steps are defined in a rolling schedule including a huge number of parameters:
Throughout the rolling process, thousands of sensors collect data that needs to be checked, and this is just where the challenge lies for steel producers.
Although the sensors usually gather and transmit the data automatically to central databases, its evaluation – if one takes place at all – is done manually. This means lots of work for the shift supervisors, and the companies run the risk of jeopardizing energy efficiency or product quality if data is not evaluated properly. Good reasons to seek to analyze sensor data automatically. In close cooperation with the users on the shop floor level, Otofacto consolidated sensor data on a central platform for a major German steel producer and prepared it so that reports could be generated.
efficient overall, but product quality should also be improved even more. The material properties of a steel strip are essentially determined by various parameters in production. The company now wanted these parameters to be monitored and saved in the long term. Using the ID of the steel strip produced at each specific time, the idea was to ensure seamless quality assurance and documentation. In our case, the management and those responsible in production had already been vexed by the manual evaluation of the sensor data for a good while. Displaying the values separately in the individual monitoring systems from different providers was just as much work as exporting them to Excel. If errors occurred, it took a long time to fix them – which could lead to significantly higher operating costs, for example in the case of, a defective temperature sensor. In the first step toward an automated solution, the specialists from Otofacto set about classifying all the sensor data from several furnaces and the production environment, and then converting it into a standardized format. In interviews with the company’s technical experts, the consultants gathered the following information:
Particular attention was paid to the last point: With several thousand generated sensors and tables with hundreds of columns, you need to know precisely what information you’re looking for.
Fast Processing of such enormous volumes of data is a real challenge. That’s why skillful selection of the queries is required to generate the reports.
Then the team prepared the selected data in such a way that it could be stored and evaluated on a universal platform. As software for the central analysis of the data, the steel producer chose the business intelligence platform from SAS. First, the Otofacto experts developed prototypes of the reports, which were then successively refined using agile development methods. Today, the company’s technical experts have 20 different base reports at their fingertips, which can be further adapted by selecting different parameters. Altogether this means several hundred different analyses can be performed – all within a short period of time. The danger of undetected errors is almost completely averted, and the automated analysis stops energy from being wasted unnecessarily and faulty materials from being produced.
Overall, the company now enjoys several advantages:
The shift supervisors in steel strip production are impressed. They can concentrate fully on analyzing the reports they receive. It’s easy to make nominal-actual comparisons and, if required, measures can be taken immediately. Furthermore, the company benefits in financial aspects: The optimal use of resources reduces operating costs in the long term and compliance with regulatory emissions standards will prevent penalties. At the same time, improved production processes contribute to higher quality results.
Letting data rest unnoticed damages every company in the long term.
The example from the steel industry demonstrates how to use this data for your own advantage.