Pharmaceutical company improves OEE by 10% in 6 months by achieving maintenance excellence
Read the story

Central Data Management Platform for analyzing aggregate Sensor Data
With energy holdings – predominantly low-carbon, including natural gas, wind and solar – in 70 countries across the globe, our client had a vision for digitalizing the sector, based on marrying vast quantities of operational sensor data with its decades of industry expertise. While data science techniques of this sort have been applied in academics and business environments, it’s rather new to the field of energy. The goal is to collect and analyze a vast array of sensor data from power generation facilities in order to mine performance-boosting insights. But technical expertise and a grand concept are not enough to overcome structural and cultural hurdles.
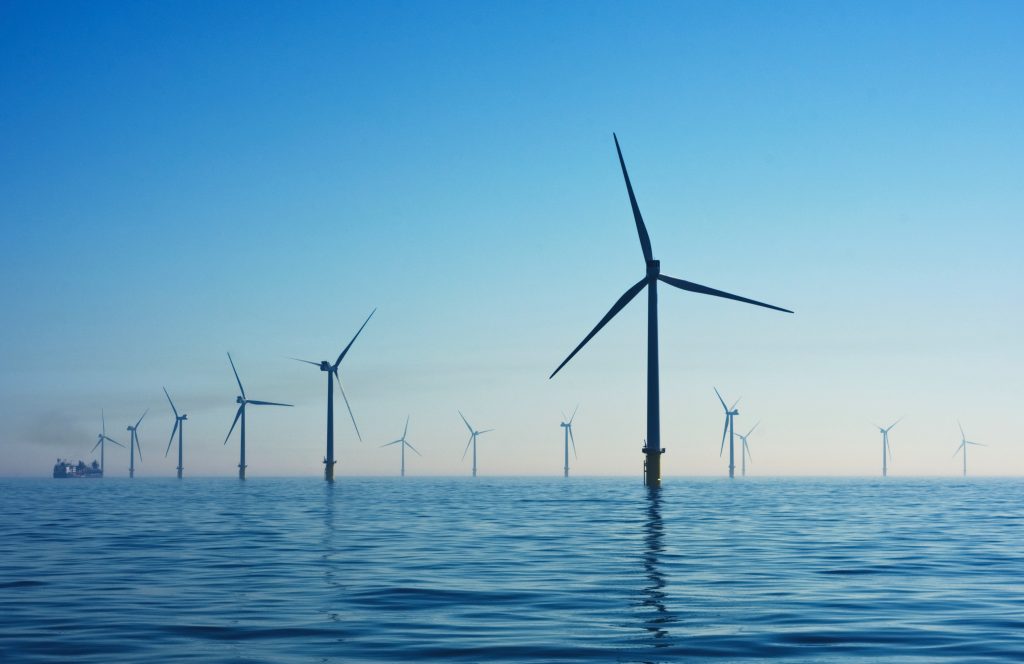
As a device that converts kinetic energy into electricity, a wind turbine has many moving parts. With movement come strain and friction, which in turn means wear. Unchecked wear can cause an abrupt halt to the workings – and while scheduled downtime is expensive for any industrial process, unplanned outages can be catastrophic. The turbines are therefore equipped with thermal sensors, accelerometers and strain gauges to continuously monitor critical rotor and gearbox parts for heat and vibrations, as well as other forces at work on the structure. The signals transmitted by these sensors are like the ‘vital signs’ taken by medical professionals to deduce the health of a patient. When a turbine’s SCADA (supervisory control and data acquisition) system indicates that, for example, a part is about to fail, the operator is alerted to take corrective measures while the cost of repair is still relatively low.
But what if all such data from the many wind farms in the client’s portfolio – a vast quantity – were aggregated in a way that they could be analyzed together? This huge statistical population could yield much more nuanced and interesting insights – worth money to energy producers, to shareholders and, ultimately, to the electricity-consuming public.
To most people working in the energy industry, information technology (IT) is just a tool for a specific purpose, and it seemed to the client’s operators that the job in question was already being done. Often in clever and inventive ways – involving everything from sophisticated Excel workbooks to unique, home-grown analysis tools – but, alas, in a different way at each site. From a global standpoint, identifying needed repairs on a case-by-case basis was only scratching the surface of what was possible – once the data landscape was made uniform. As a world player with operations across the globe and decades of experience in the industry, our client realized that, if the deep expertise it already possessed were combined with this ‘big power data,’ huge potentials for optimization would emerge.
So, the client designed a digital platform for real-time monitoring and control of its renewable energy sites. Using data science tools to analyze the vast quantity of data transmitted by the sensors at multiple installations, it would be possible to carry out predictive maintenance on a grand scale. This would not only improve the performance/cost ratio at these facilities but also provide the basis for much more.
But first, the client would have to get a hold of the data, which was locked up in the disparate IT landscape that is the inevitable result of mergers and acquisitions. Furthermore, since some legacy equipment had been supplied with proprietary SCADA systems, additional hardware/software would have to be installed in the field: perhaps a parallel SCADA system at this older wind farm, or additional sensors at that solar park. To some operators, that can come across as invasive. And why share data that could represent a decisive edge? There had to be a real reason to participate. In a fiercely competitive market, it would only make sense to the operators if they understood the value and could expect a good return on information.
That’s when the client turned to the Positive Thinking Company to provide an intermediary between the business side and the development team: a n advocate for the business users, someone sympathetic to their expectations of the product, someone to meet with them regularly and report on the new features being developed, someone to take their side and make sure they were proactively involved in the product development.
While the client’s executive management was sure of the untapped potential, the end users had to be persuaded that their contributions would be worthwhile. And the energy producers’ needs had to be conveyed to IT so that the project could fulfill them. So, the Positive Thinking Company set up a mirror of the client’s agile framework for the business users as well, placing a ‘product owner’ (in agile terms) onsite to lobby on their behalf to the development team. According to scrum methodology, the product owner – in this case an engineer with an extensive IT background – is tasked with representing stakeholders on both sides of the IT product and maximizing its value for the end users. Agile development practices are iterative in nature and demand continual communication and frequent meetings; the scrum workflow foresees breaking the project down into manageable parts and regularly discussing its progress in small steps, ensuring that the functionalities delivered are actually useful – and the ones the customer needs. Assumptions and expectations are discussed and exposed, paring the requirements down to the commonalities that all the business users agree on. The product owner then expresses this to the development team in a language that IT can understand – and the cycle starts over again. Back and forth, step by step, the customer and the developers come to agreement on what the software needs to do. Serving thus as a liaison between the development team and the business side, the product owner enforces transparency: negotiating priorities in project scope and schedule, educating stakeholders on the development process and demonstrating the solution to them, organizing milestone reviews and documenting the (often changing) requirements in a backlog. For example, so that the end users could ‘see and feel’ how the system would work once it was up and running, the product owner mocked up the developers’ ideas of, say, the application’s browser-based interface, and then translated the operators’ doubts and concerns into development stories that could in turn be addressed by IT.
Now that the data platform is analyzing actual sensor data from wind farms, it’s starting to provide that promised return on information. And this will only get better: every new facility that comes online in future not only benefits from what’s already been learned, it provides new data that will contribute further to the insight-generation engine.
While, by itself, the prediction environment for maintenance was already a compelling raison d’être, it’s just part of the plan. Once there’s a critical mass of data in the system, other ways to help plant operators manage their assets begin to surface. A color-coded user interface – like a management dashboard – provides an intuitive overview of real-time performance, weather, momentary output, capacity used, etc. Big problems can be seen quickly. And the predictive models used by the system can be used to make the connected facilities more profitable overall.
For example, when more sensors are added to capture data on local weather, like rain gauges or sensors to log air density directly at the turbine nacelle (rather than relying on nearby meteorology stations), then the system can help identify time frames during which maintenance can be carried out most cost-effectively – like when the forecast calls for conditions that will reduce energy production anyway. Further combining that knowledge with pricing information from the electricity spot market would greatly help an operations manager to schedule maintenance crews for a time when it would have the least impact on the bottom line. And someday, maybe we’ll be able to remotely detect ice on turbine blades or deduce when solar panels are dirty.